VNPS Funded Research Reveals Which Trees are Dying and Why
Editor’s Note: This post describes the 2019 research project conducted by Alyssa Terrell and supported by a VNPS Research Grant and was edited for publication. Our Research Grant Program awards funds for well-defined projects whose results can be evaluated and which address the VNPS Mission and Goals. Learn more about the Grant Program and how to apply.
By Alyssa Terrell
Please consider this the final report for the VNPS funded proposal “Drivers of Tree Mortality in Virginia’s Blue Ridge Ecoregion.” The funds supported me to do an internship in the lab of Kristina Anderson-Teixeira, during which I led and completed our annual 26-ha tree mortality census. The census took place at the Forest Global Earth Observatory (ForestGEO) large forest dynamics plot at Smithsonian Conservation Biology Institute (SCBI) in Front Royal, Virginia during summer 2019.
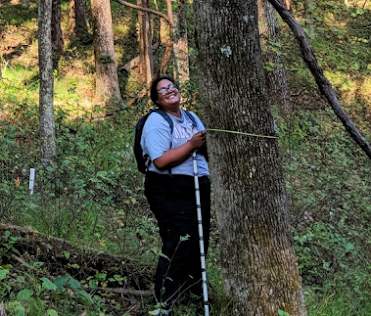
My research focused on the mortality rate of trees ≥10cm, as well as Fraxinus ≥1cm (10,477 stems total). The health statuses (alive, alive but unhealthy, dead standing, dead fallen) of each tree was recorded, and if the tree had died, information such as final stem diameter, canopy position, and any symptoms associated with disease were also noted. I also collected tree cores from 79 individuals, and these will eventually be used to help understand the causes of mortality, along with how climate shaped the tree’s growth during its lifetime (For example, cores from the 2017 census, also funded by VNPS, have contributed to two publications: McGregor et al. in prep; Helcoski et al. 2019). The data have been checked, finalized, and made publicly available online. As the lead technician for the census, I went into the 640m x 400m plot at least 4 days per week, ~8 hours per day (total field time: 229 hours) recording electronically the aforementioned factors for each of the 10,477 stems.
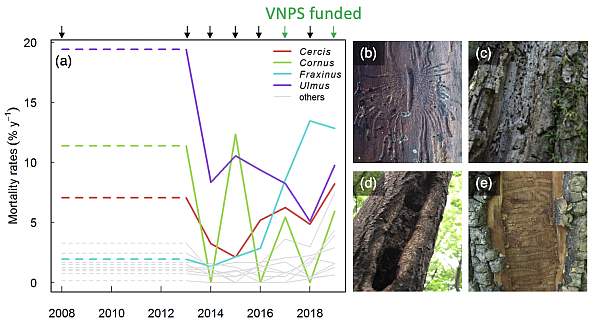
This was our sixth annual mortality census, and the long-term record has revealed trends in tree mortality. One striking trend is the increase in ash (Fraxinus spp.) mortality, due to the invasive Emerald Ash Borer, from 2016 through 2018, now leveling off in 2019 (Fig. 1a,e). We have also observed anomalously high mortality rates for slippery elm (Ulmus rubra), on which we have observed the signs of the invasive Dutch Elm Disease (Fig. 1a,b), along with dogwoods (Cornus spp.) and redbud (Cercis canadensis), both affected by fungal pathogens that have been spread globally by human activities (Fig. 1a,c-d). We have paired these results with long-term data from Shenandoah National Park to characterize the long-term impact of exotic forest insects and pathogens over the past several decades, showing that these have increased tree mortality by roughly 25% over the decadal to centennial time scale (Anderson-Teixeira et al. in revision; I am a co-author). Documentation like this is important not only for the specific region, but also as the first study to quantify the long-term cumulative impact of invasive pests and pathogens on temperate forests anywhere in the world.
Figure 1. Elevated tree mortality rates attributable to exotic insects and pathogens in the SCBI-ForestGEO plot from 2008 to 2019. (a) Mortality rates of trees ≥10cm DBH, with genera affected by exotic forest insects and pathogens during this time period shown in color and others in grey. Included are genera with N≥100 individuals in 2008, with the exception of focal taxa Cornus (N2008=29). Dashed line indicates annualized mortality rate for the period prior to initialization of the annual census. Arrows on upper axis indicate census years (with VNPS-funded surveys in green). Impact of the insect/pathogen was confirmed though observations of signs and symptoms of the disease on recently dead individuals: (b) Gallery of Dutch elm disease vector Scolytus multistriatus on Ulmus rubra; fungal cankers / stem rot on (c) Cornus florida and (d) Cercis canadensis, and (e) Agrilus planipennis galleries under the bark of Fraxinus americana. Figure from Anderson-Teixeira et al. (in revision).
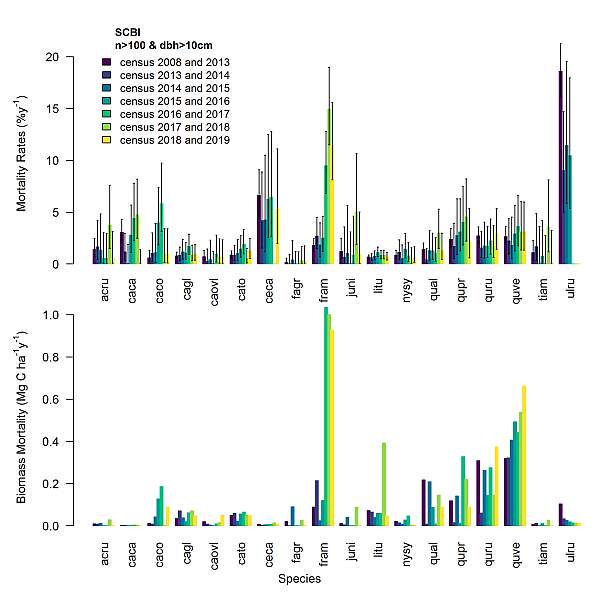
Beyond the role of invasive pests and pathogens as a driver of tree mortality, the annual mortality census is also revealing some other trends of interest. We have noted that oak mortality – particularly Q. velutina and Q. rubra – is disproportionately high and possibly increasing, contributing substantially to the total biomass loss in the plot (Fig. 2). We are beginning research seeking to improve our understanding of the drivers of oak mortality.
Figure 2. Summary of tree species’ mortality rates (percent of individuals that die per year) and biomass mortality (total mass of trees that die) over the history of the SCBI-ForestGEO plot. Species codes are as follows: ACRU = Acer rubrum, CACA = Carpinus caroliniana, CACO = Celtis occidentalis, CAGL = Carya glabra, CAOVL = Carya ovalis, CATO = Carya tomentosa, CECA = Cercis canadensis, FAGR = Fagus grandifolia, FRAM = Fraxinus americana, JUNI = Juglans nigra, LITU = Liriodendron tulipifera, NYSY = Nyssa sylvatica, QUAL = Quercus alba, QUPR = Quercus prinus, QURU = Quercus rubra, QUVE = Quercus velutina, TIAM = Tilia Americana, ULRU = Ulmus rubra.
In addition to the scientific knowledge gained, the funding of this project created numerous learning opportunities for myself and others. I personally gained more knowledge of the flora of Virginia through daily exposure (plant identification), hands-on experience with causes of mortality, tree coring, and managing data in a clear and concise form. I have also had the opportunity to contribute as a co-author to a scientific manuscript (Anderson-Teixeira et al. in revision) and a book (Gonzalez-Akre et al. in prep) that use the data I collected and to help train four students/volunteers (see below). Finally, I had the opportunity to share what I had learned with VNPS members during a tour through the ForestGEO plot that the Ecosystems and Climate lab hosted in late September. The experience gained has made me more passionate about forests and has made me realize that I would like to pursue a career in data and forestry management.
As is the tradition with our annual mortality census, I had two volunteers assisting, as well as a Smithsonian-Mason School of Conservation (SMSC) students, and these individuals also gained knowledge of our native tree flora and factors affecting their health. One of the SMSC student conducted a project seeking to align dead trees observed in aerial imagery taken by a drone with those detected in our mortality census. The conclusion of this project was that drones may someday prove useful in complementing our on-the-ground observations but could not provide an effective substitute.
Furthermore, I am currently helping to mentor a second SMSC student, whose project revolves around cores taken during our mortality census. This student is processing (mounting, sanding, scanning, and organizing) cores that I collected during this year’s mortality census. He is also analyzing tree growth prior to mortality using cores that have already been dated and measured from the 2016 and 2017 (also funded by VNPS research grants) censuses. His preliminary finding is that oaks that died in these years typically started declining about a decade prior to mortality.
As seen from this report, the support from Virginia Native Plant Society has proved to be beneficial both in expanding our knowledge of the forests within Virginia’s Blue Ridge ecoregion and in providing opportunities for myself and several others to gain valuable experience in forest ecology research. Because this census was part of a long-term study, the results build upon past censuses and will be built upon by future censuses, becoming increasingly valuable as the length of the record increases. I am grateful to VNPS for the continued support and hope that this partnership will continue in the future.


